Toro Insights
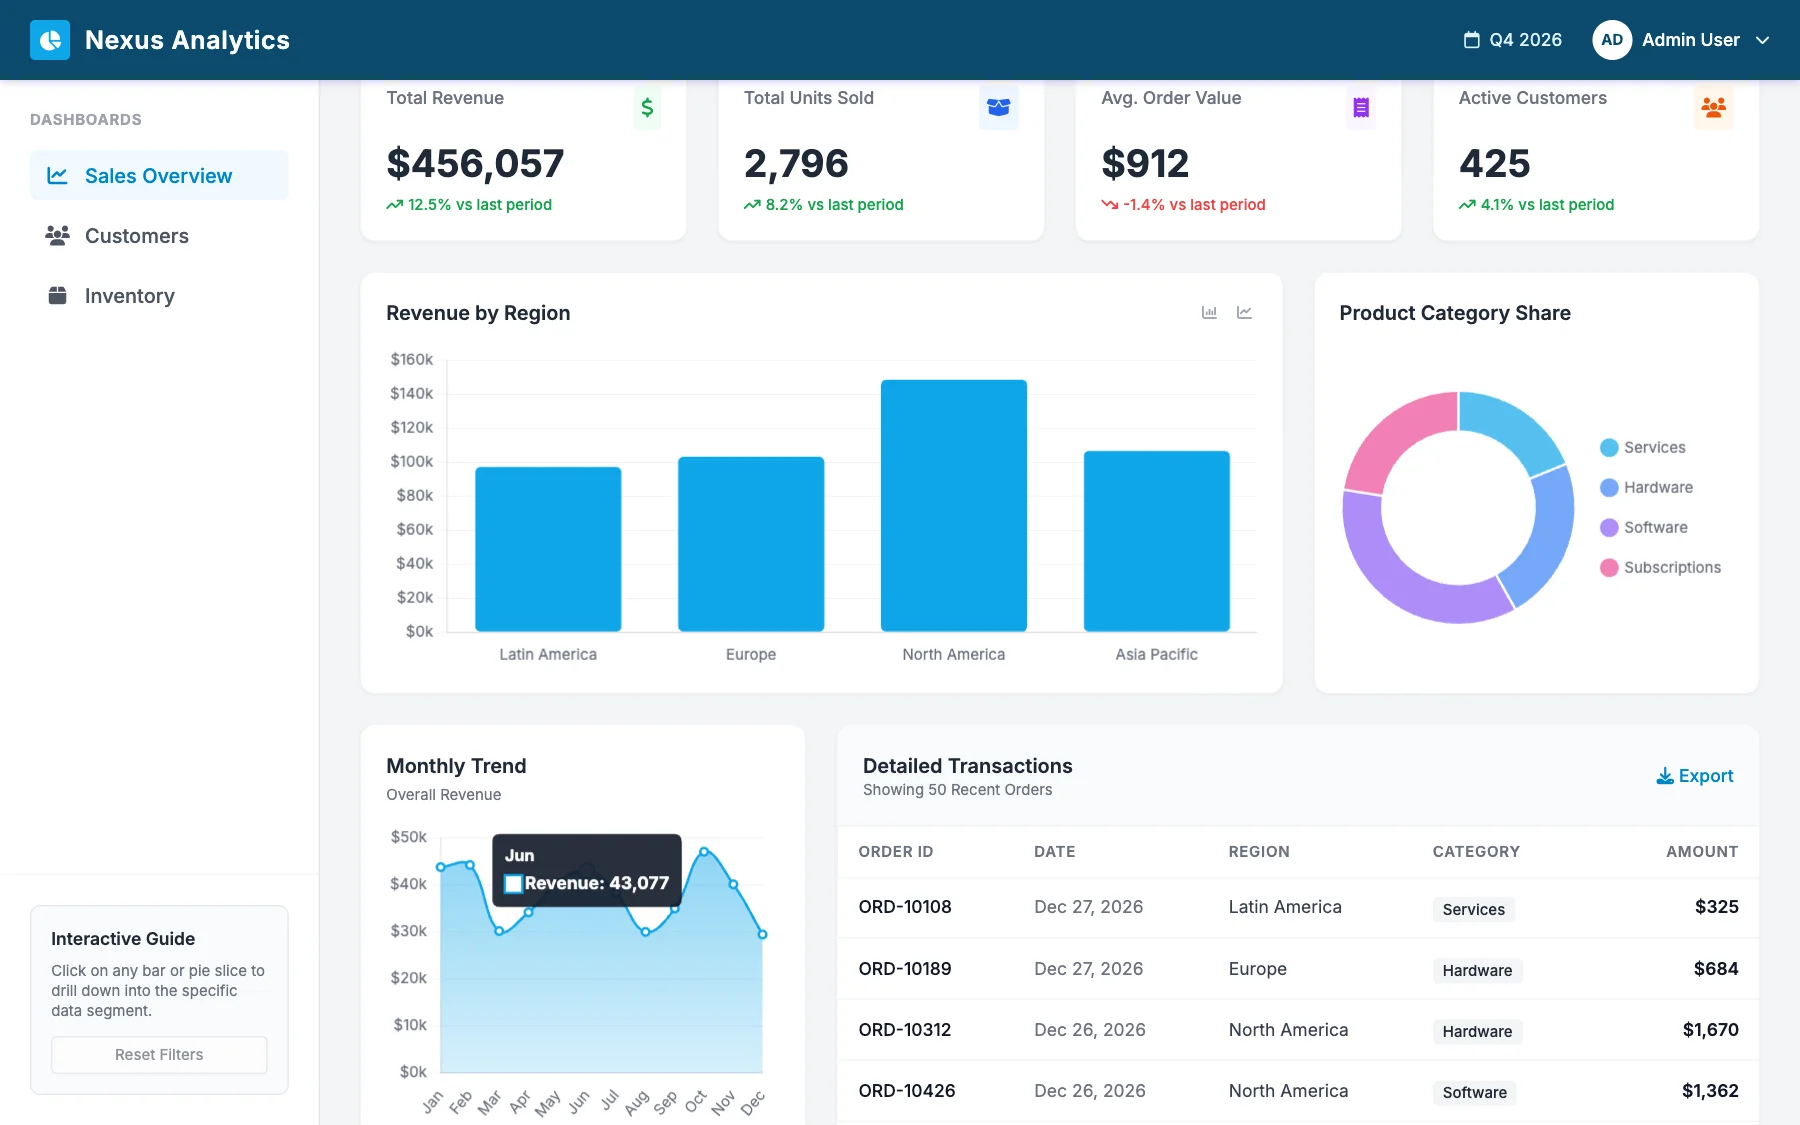
Interactive demoClick a region or a category and the whole dashboard answers.
A working demo on sample data — click around, nothing is saved or sent. Open full-screen ↗
Click any bar or slice to drill down
KPIs, trend and transactions update together
Year, quarter and month views
Export the filtered transactions
Most dashboards are a set of charts that disagree with each other. Toro Insights is built on a single semantic layer: one definition of revenue, units and customers, so every tile changes together when you drill into a region or a product category.
What you get
- Sales overview with revenue, units, order value and active customers
- Drill-down by region and category, with a detailed transaction list
- Connects to SAP (CDS views / OData), a warehouse, or a DuckDB file for smaller teams
Try it above — click a region bar, then a category slice, then reset.
Want Toro Insights on your own data? We'll show you how it connects to your systems in a 30-minute call.
Book a walkthrough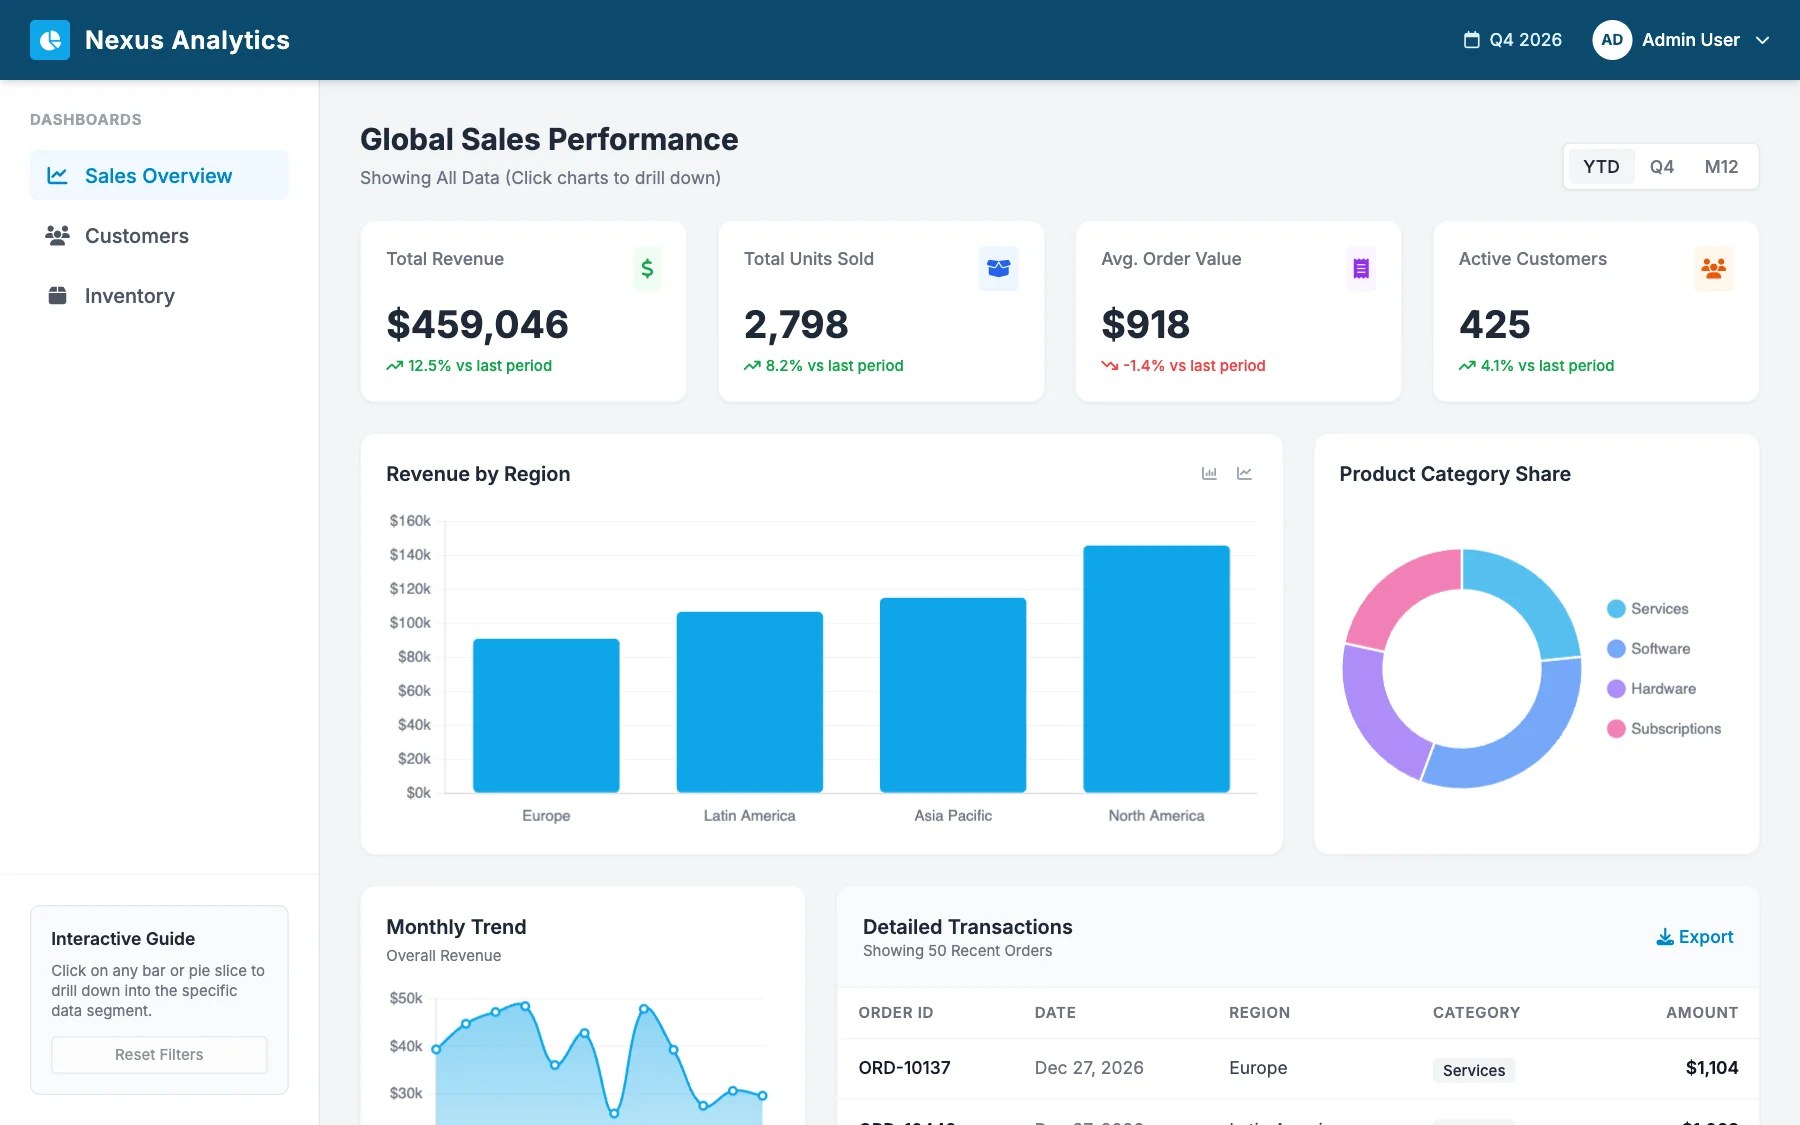
More products
Tell us about the process that hurts.
A 30-minute call is enough to tell whether an agent, an extension or a plain good Fiori app is the answer. No deck, no discovery fee.